Fitting Basics
This section describes the basic usage of fitterpp.
- To install the package use:
pip install fitterpp
To use the package in your code, include the following statement at the top of your python module:
import fitterpp as fpp
To do fitting, you must first write a parameterized function. For example, consider the following function for a parabola the has two parameters: * where the parabola is centered on the x-axis * a multiplier for how quickly the y-value increases
def calcParabola(center=None, mult=None, xvalues=range(20), is_dataframe=True):
    estimates = np.array([mult*(n - center)**2 for n in xvalues])
    if is_dataframe:
        result = pd.DataFrame({"row_key": xvalues, "y": estimates})
        result = result.set_index("row_key")
    else:
        result = np.array([estimates])
        result = np.reshape(result, (len(estimates), 1))
    return result
Note that all arguments to calcParabola are specified using keywords.
Fitterpp requires both an array and DataFrame output for efficiency reasons and to make
the user function self-describing.
The keyword argument is_dataframe specifies whether to return a numpy array or a DataFrame.
The array should contain only the data values.
The DataFrame must:
contain columns names that match some of the names in data provided to
Fitterpp;have an index with values that have a non-null intersection with index values in the data provided to
Fitterpp.
You will also need to describe the parameters to be fitted.
In our example, these are center and mult.
You use
lmfit.Parameters
to describe these parameters, as shown below.
parameters = lmfit.Parameters()
parameters.add("center", value=0, min=0, max=100)
parameters.add("mult", value=0, min=0, max=100)
Last, you must provide data that is used to fit the parameters.
The data should be a pandas DataFrame that has some (or all)
of the columns present in the output of the function to be fit.
print(data_df)
row_key   y
0       203.602263
1       168.826647
2       129.106718
3       106.392522
4        76.568092
5        53.599780
6        32.178451
7        27.475269
8        17.673933
9         5.571118
10        9.088864
11        4.040736
12       10.043712
13       20.858908
14       32.427186
15       53.417786
16       80.242909
17      104.973683
18      132.189584
19      169.439043
and outputs a list (or list-like) of floats that are the difference between what the function computed for these parameter values and observational data.
To do a fit, use:
fitter = fpp.Fitterpp(calcParabola, parameters, data_df , methods=methods)
fitter.execute()
To see the resulting fits:a
>print(fitter.final_params.valuesdict())
{'center': 9.991226336877833, 'mult': 2.072849009501976}
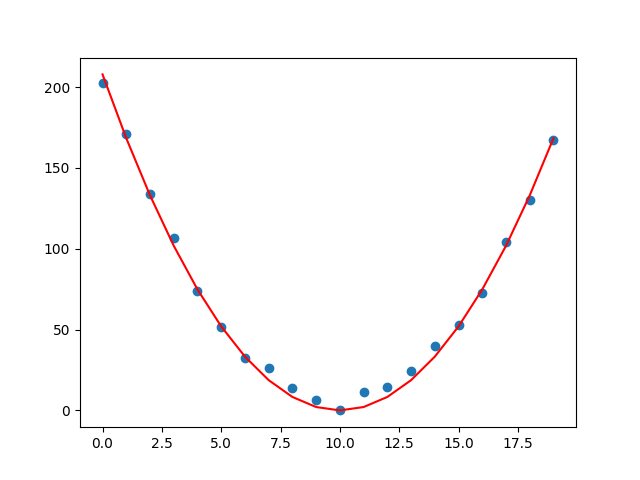
The figure below displays the parabola (red line plot) for the above fitted parameter values along with the fitting data (blue scatter plot).